Analyzing data
VivoLead is designed to make it easy for you see the result of every sales event whenever you want to.
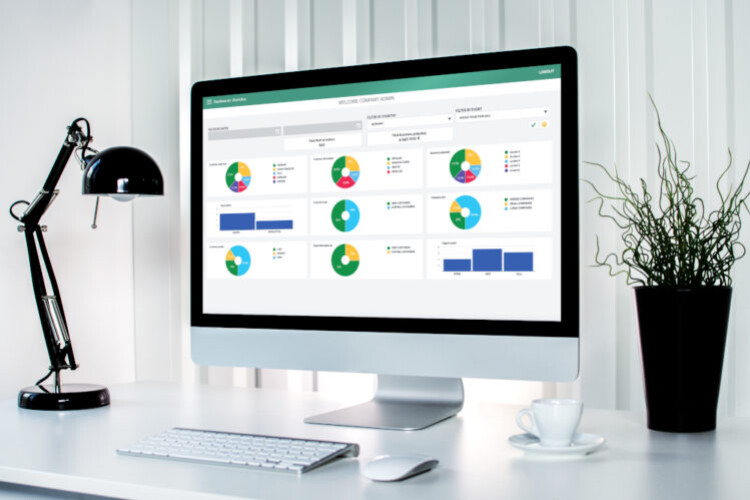
In the graphic dashboard you can see all your data from your sales events in one place. It is intuitive and easy to use – even for first-time users.
Simply log onto your VivoLead cloud account and get started.
Country visits
Find out which countries your opportunities on every sales event are coming from.
Opportunity description
See how many of your opportunities are distributors, manufactures, or retailers.
Business potential
See how much your salespersons estimate the value of the potential business.
Subscriptions
See how many of your opportunities have signed up for your survey or newsletter.
Opportunity type
See if you are bringing in new opportunities or strengthening relations with existing opportunities.
Company size
Discover whether your opportunities come from small, midsize or large companies.
Opportunities priority
See how many opportunities need your immediate attention and how many can wait.
Want information as
Find out how many opportunities options for printed sales documentation over digital.
Urgent needs
See how many opportunities has urgent needs that requires action from you.
Product interests
See how many opportunities were interested in each product/product category.
No. of opportunities
In the top left side of the graphic dashboard, you can see how many opportunities you have.
Change the dashboard
We can change any chart on the dashboard if you want other or more data.
Filter by date
when you press ‘filter by date’, you can easily see data for one specific date or defined period.
Filter by country
Filter by country and see if opportunities from different countries have different interests.
Filter by event
You can easily find data on a specific sales event by using the ‘filter by event’ function.
Combine filters
Combine filtrations to get data on a specific single day on a specific sales event.